Most Dangerous States to Drive In vs. Safest States to Drive In
Mar 12, 2021
Despite a decrease in overall vehicle miles traveled in 2020 due to the Covid-19 stay-at-home orders, Americans were no safer on highways and city streets than years prior. Fewer cars on the road initially led to a decrease in car accident rates at the beginning of the pandemic; over time, however, drivers began engaging in dangerous behaviors while on the road, like speeding, driving without wearing a seatbelt, and driving under the influence of drugs or alcohol.
While these behaviors may be the inevitable result of too much time at home, increased unemployment, and the stress of surviving an unprecedented global virus, they have ultimately come at great cost, with motor vehicle fatality rates up 30% in the second quarter of 2020 alone. The roll-out of the vaccine and gradual reopening of workplaces mean commuters and travelers will be back on the roads with these dangerous drivers —and we wanted to know where they’re most at risk behind the wheel.
Methodology
To determine the most dangerous U.S. states for drivers, we collected data for the following risk factors associated with motor vehicle accidents and fatalities in all 50 states and the District of Columbia. Each factor was weighted based on its contribution to a state’s overall levels of risk and road safety. States could earn a total of 50 points, where states with higher scores are considered more dangerous, and states with lower scores are considered less dangerous.
Ranking Factors
- Number of Licensed Drivers Per Capita
- Source: Department of Transportation
- Weight: 0.25
- Number of Licensed Drivers Between the Ages of 16-19 Per Capita
-
- Source: Department of Transportation
- Weight: 1.00
- Number of Motor Vehicle Fatalities Per Capita
-
- Source: Department of Transportation
- Weight: 1.00
- Number of Serious Motor Vehicle Injuries Per Capita
-
- Source: Department of Transportation
- Weight: 1.00
- Number of DUIs Per Capita
-
- Source: Department of Transportation
- Weight: 0.75
- Average Daily Traffic Per Lane
-
- Source: Department of Transportation
- Weight: 0.35
- Average Annual Precipitation
-
- Source: Statista, NOAA
- Weight: 0.20
- Highest Posted Speed Limit Greater Than or Equal to 70 mph
-
- Source: Insurance Institute for Highway Safety
- Weight: 0.20
- Statewide Texting While Driving Ban for All Drivers While Operating a Vehicle
-
- Source: Governors Highway Safety Association
- Weight: 0.25
Note: Factor weights are determined by the research team’s judgment on what is most important to the ranking.
The Most Dangerous States for Drivers
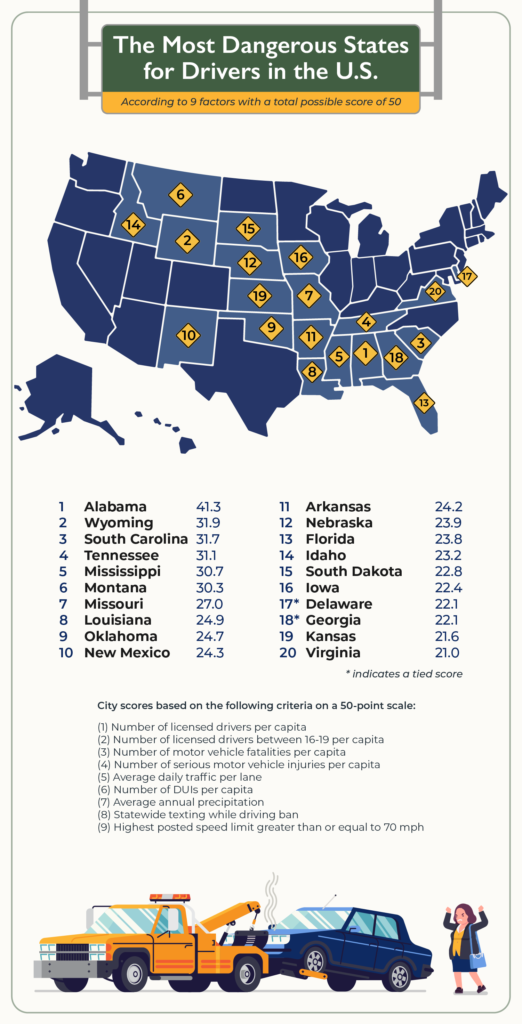
Out of a possible score of 50 points, Alabama ranked first as the most dangerous state for drivers with 41.3 points. While high rates of DUIs and serious motor vehicle injuries certainly contributed to Alabama’s ranking, perhaps the most crucial factor was the number of young Alabamians on the road. With almost 4,500 drivers between the ages of 16 and 19, for whom the risk of a fatal crash is higher than any other age group, the Yellowhammer State is likely to see higher rates of accidents and fatalities than states with older drivers.
Nine out of the 20 most dangerous states to drive in are located in the South—the largest regional showing.
These states tended to have high numbers of young drivers, motor vehicle fatalities, and DUIs across the board. Interestingly, Tennessee was the only southern state to ban texting only while the vehicle is in motion rather than while broadly operating the vehicle. Virginia rounds out the list with a high level of daily traffic and a notable number of serious injuries from motor vehicle accidents.
All but one of the 20 most dangerous states for drivers had a highest posted speed limit greater to or equal than 70 mph—in Delaware, 65 mph is fast enough.
The Safest States for Drivers
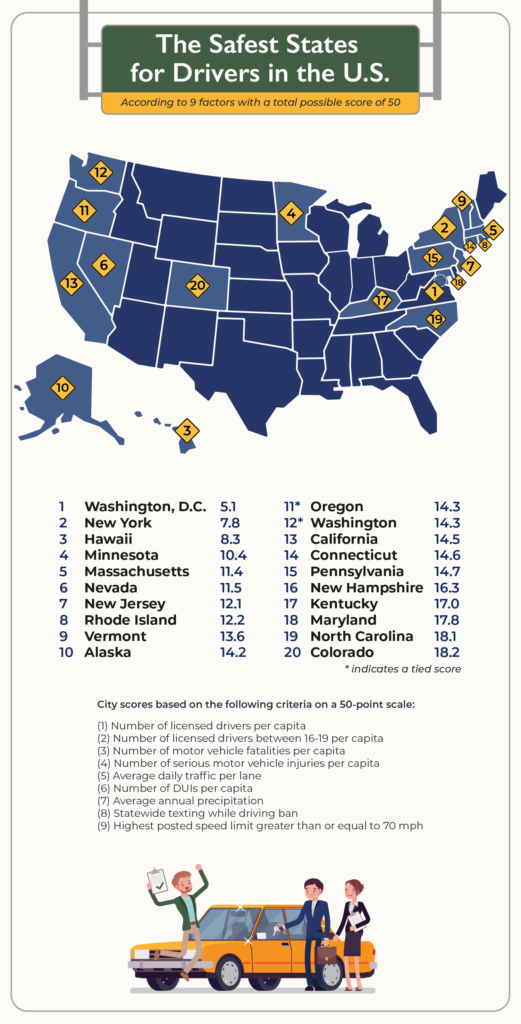
For drivers looking to avoid collisions with teenage drivers or drivers under the influence, Washington, D.C. offers a safe haven, with a total score of 5.1 points out of a possible 50. Unsurprisingly, drivers between ages 16 and 19 don’t make up a significant portion of the driving population in a city built for young professionals, with only 132 drivers aged 16-19 per capita.
Moreover, D.C.’s reliable public transportation system, the MetroRail, offers a safe and accessible alternative to driving that many residents take advantage of. The availability of public transportation may have also played a role in New York, where low numbers of young drivers, accident fatality rates, and DUIs placed the state in second place for safety, with a total score of 7.8 points. Generally, the 20 safest states to drive in had lower serious injury and fatality rates, lower speed limits, and fewer DUI reports.
Full Data
Interested in diving deeper into the numbers for the most dangerous and safest states for drivers, or wanting to see how your state ranks if it’s not listed within the above maps?
We’ve compiled our full data study for all 50 U.S. states and the District of Columbia analyzed into this interactive data table. Search for the state you call home or click on the heading of each column to sort by that category!
If you’ve been injured in a car accident and are in need of legal services, contact a personal injury attorney like the team at Edwards Kirby to learn more about your options.
Related Posts

We’re Here to Help
Call 919-780-5400 or fill out our online form to request a free consultation. You won’t pay unless we win!